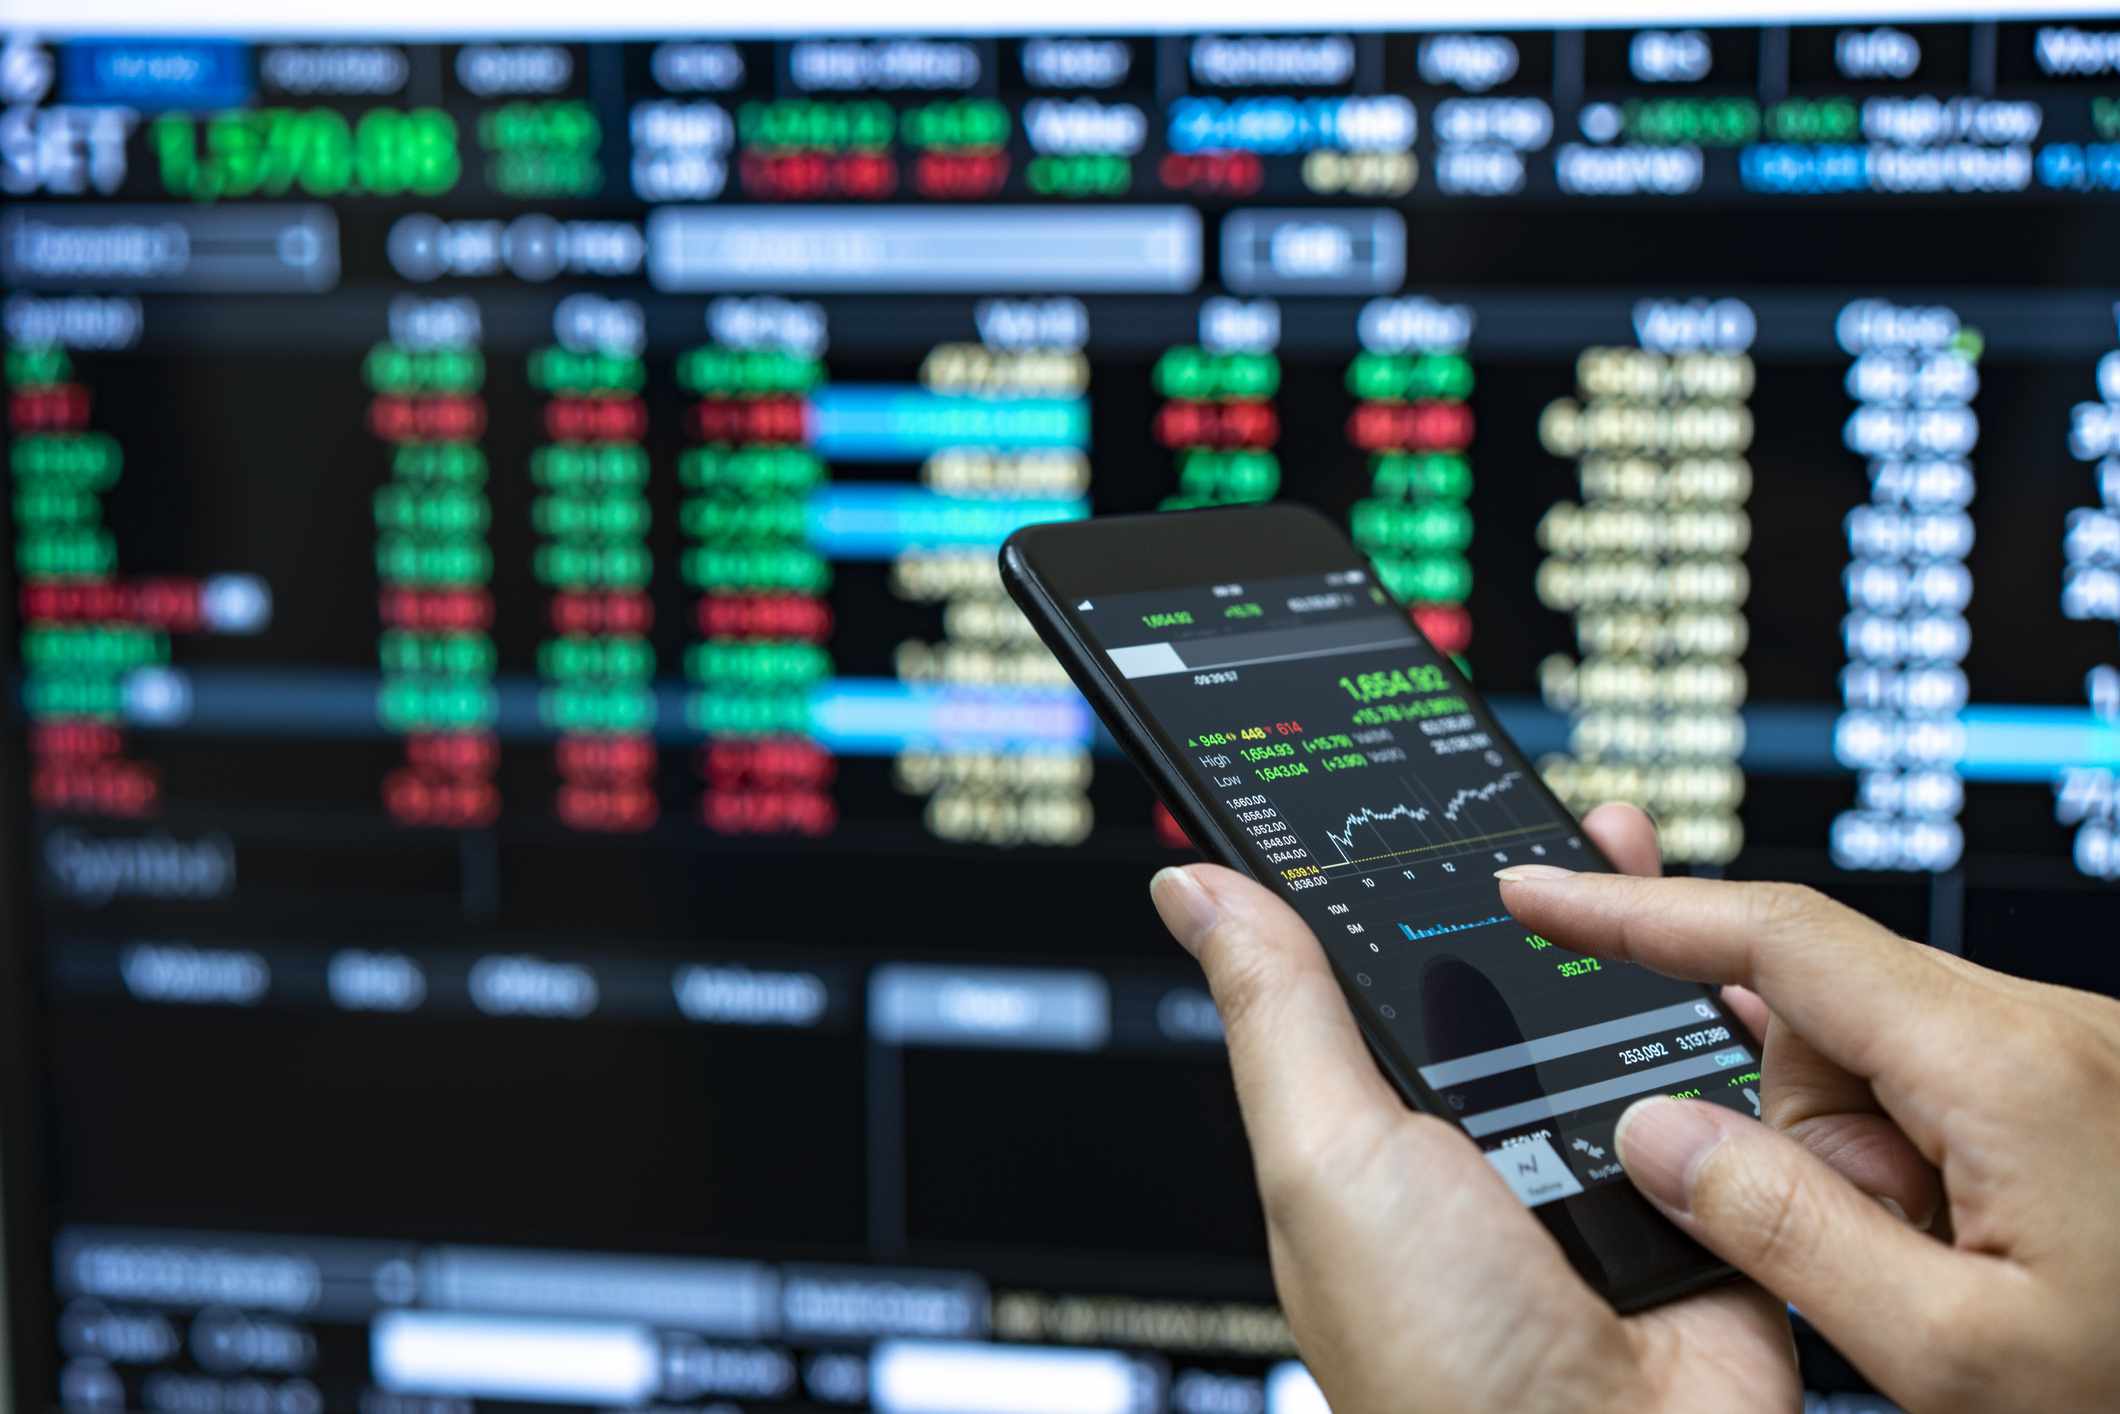
Everyone wants to earn a significant amount of money in the options market. To secure a big profit from this market, novice traders often take high risks and lose a significant portion of their trading capital. But to make regular profit in the options market, a trader has been strategic with his actions. He can’t take random trades and expect to make a big profit without evaluating the data in a proper way. To make things easier, the best course of action for a rookie trader is to learn the art of trend trading strategy.
Taking the trades with the existing trend might seem easy but it is actually a difficult task. But if you know the key steps, you should be able to ride the major trend with a high level of precision. Go through this article as we are going to discuss some essential steps to trade with the major trend.
Table of Contents
Selecting the time frame
To trade with the trend, you need to find the trend properly. Usually, professional traders rely on the trend line tool to analyze the market data. But if you use the trend line tool in the minute time frame, you are not going to get an accurate trend line. In fact, you might even end up trading the trades in the retracement phase. To avoid such issues, draw the trend line in the H4 or in the daily time frame only. Once you start trading in a higher time frame, you will become more confident with your actions. And remember, support and resistance level drawn in the higher time frame tends to provide better results to the traders.
Use the moving average
The rookies often complain that they can’t find the perfect trend in the market. To solve this problem, the professional traders encourage them to use the 100 and 200-period moving average. Many traders use these moving averages in fx options trading as it helps them identify the dynamic support and resistance level. If the price of a certain asset trades above these moving averages, you may expect the overall trend is bullish. On the contrary, if the price trades below the 100 and 200 periods moving average, you should consider it as a bearish trend. Note that you can also take the trades right at the 100 and 200 periods moving average with a high level of accuracy.
Use the oscillators
One of the easiest ways to find the overbought and oversold state of an asset is to use the oscillator. To make things easier, you may learn the use of the stochastic indicator. If the stochastic reading is above 80 marks and the price is near the trend line resistance, you may look for the short trade setup. On the contrary, if the stochastic reading is near the 20 marks and the price is at the trend line support level, you should be looking for the long trade setup. But be careful while analyzing the data in the lower time frame. Avoid taking the data right before the news release as the market direction might change without any prior notice.
Use the Fibonacci retracement tools
Elite traders use the Fibonacci retracement tools along with the trend line to find reliable trade signals. By doing so, you can find very high-quality trade signals in the market. It might take a while to get used to the functions of the Fibonacci retracement tools but once you do, you will become more strategic with your trade setups. But remember, if the price breaks the 61.8% retracement level, it is a strong indication that the price is going to change the trend. In most cases, such a break takes place right after the major news release. So, if you carefully evaluate the trade signals by analyzing the economic calendar, you should be able to avoid the most prominent trend reversals in the market. But remember, you can’t avoid all the losing trades even after trading with the trend.


